ARTICLE
ARTICLE
Interactions Within Earth's Atmospheres
Interactions Within Earth's Atmospheres
In this activity, students use computational models to explore how Earth's surface and greenhouse gases interact with radiation. Then they interpret real-world changes in atmospheric carbon dioxide over short and long time frames.
Grades
7 - 12+
Subjects
Earth Science, Climatology
Image
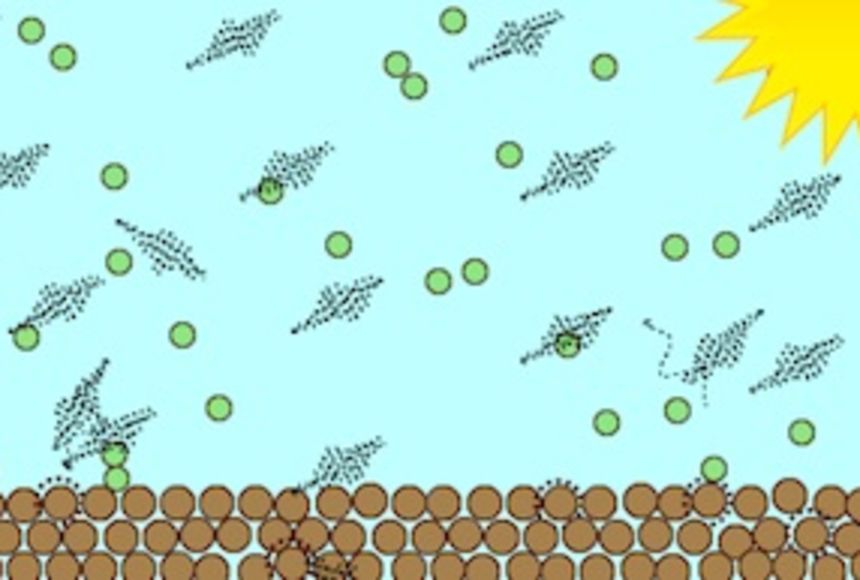
Climate Activity
Use models to understand how radiation interacts with greenhouse gases to cause warming.
Skeptical Science image provided by Concord Consortium
Learning materials
Articles & Profiles
This activity is part of a sequence of activities in the What Is the Future of Earth's Climate? lesson. The activities work best if used in sequence.
What You'll Need
Required Technology
- Internet access: Required
- Tech setup: 1 computer per classroom, 1 computer per learner, 1 computer per small group, Projector
Physical Space
- Classroom
- Computer lab
- Media Center/Library
Grouping
- Heterogeneous grouping
- Homogeneous grouping
- Large-group instruction
- Small-group instruction
Overview
In this activity, students use computational models to explore how Earth's surface and greenhouse gases interact with radiation. Computational models are used to explore phenomena that are too large, too small, too quick, or too slow to observe otherwise. The computational models with which you may be familiar are used for forecasting weather events such as hurricanes. Scientists are more confident in the output of their models when they can input a lot of data. Other scientists check their models against what happens in reality; when the model accurately reflects what happens in reality, scientists can be more confident in their models.
Greenhouse gases warm the atmosphere by trapping outgoing infrared (heat) radiation. Sunlight brings visible (and ultraviolet and infrared) light to Earth. The radiation can be absorbed by Earth's surface, or it can be reflected back into space. The radiation that is absorbed heats molecules in Earth's surface. This heat energy, or infrared radiation, is radiated back out towards space. The infrared energy can be absorbed and re-emitted by greenhouse gases in the atmosphere. This absorption and re-emission keeps heat trapped in the atmosphere for longer periods of time, leading to an increased atmospheric temperature.
Learning Objectives
Students will:
- explore and critically analyze real-world data about changes in atmospheric carbon dioxide levels over Earth's history
- describe what happens when solar radiation interacts with Earth's surface and atmosphere
- explain how greenhouse gases cause Earth's temperature to warm
Teaching Approach
- Learning-for-use
Teaching Methods
- Discussions
- Multimedia instruction
- Self-paced learning
- Visual instruction
- Writing
Skills Summary
- 21st Century Student Outcomes
- Information, Media, and Technology Skills
- Learning and Innovation Skills
- Critical Thinking and Problem Solving
- 21st Century Themes
- Critical Thinking Skills
- Analyzing
- Evaluating
- Understanding
Directions
1. Activate students' prior knowledge about greenhouse gases.
Tell students that greenhouse gases cause a warming of Earth's atmosphere. Have students brainstorm a list of greenhouse gases and hypothesize how they warm Earth's atmosphere. Student responses should include greenhouse gases such as carbon dioxide, water vapor, and methane. Responses about how these gases warm Earth's atmosphere should include that the gases prevent the escape of heat energy (infrared radiation) from the atmosphere.
2. Discuss the role of uncertainty in the scientific process.
Tell students that science is a process of learning how the world works and that scientists do not know the “right” answers when they start to investigate a question. Let students know they can see examples of scientists' uncertainty in climate forecasting.
Show the Global Temperature Change Graph from the 1995 IPCC (Intergovernmental Panel on Climate Change) report. Tell students that this graph shows several different models of forecast temperature changes. Ask: Why is there more variation (a wider spread) between the models at later dates than at closer dates? (There is more variation between the models at later dates than at closer dates because there is more variability in predicting the far future than in predicting the near future.)
The ability to better predict near-term events occurs in hurricane and tropical storm forecasting as well. Project The Definition of the National Hurricane Center Track Forecast Cone and show students the “cone of uncertainty” around the track of the storm. Tell students that the cone shows the scientists' uncertainty in the track of the storm, just as the climate models show the scientists' uncertainty in how much Earth's temperature will change in the future. Ask: When are scientists most confident in their predictions? (Scientists are most confident in their predictions when they have a lot of data. This is why the forecast for near-term events is better than forecasts of longer-term events, both in storm forecasting and in climate forecasting.)
Tell students they will be asked questions about the certainty of their predictions and that they should think about what scientific data are available as they assess their certainty with their answers. Encourage students to discuss the scientific evidence with each other to better assess their level of certainty with their predictions.
3. Discuss the role of systems in climate science.
Tell students that forecasting what will happen in Earth's climate system is a complicated process because there are many different interacting parts. Scientists think about how one part of the system can affect other parts of the system. Give students a simple example of a system, as described in the scenario below.
On an island, there is a population of foxes and a population of rabbits. The foxes prey on the rabbits. Ask:
- When there are a lot of rabbits, what will happen to the fox population? (It will increase because there is an ample food supply.)
- What happens to the fox population when they’ve eaten most of the rabbits? (The foxes will die of starvation as their food supply decreases.)
- What happens to the amount of grass when the fox population is high? (The amount of grass will increase because there are fewer rabbits to eat the grass.)
- If there is a drought and the grass doesn’t grow well, what will happen to the populations of foxes and rabbits? (The rabbit population will decrease because they have a lesser food supply. The fox population should also decrease as their food supply decreases.)
Humans introduce dogs to the island. The dogs compete with the foxes over the rabbit food supply. Ask: What will happen to the populations of foxes, rabbits, and grass after the dogs are introduced? (The foxes will decrease because they are sharing their food supply, the rabbits will decrease because they have more predators, and the grass will do well because of the lowered impact of the smaller rabbit population.)
Tell students that these simple cause-effect relationships can expand into more complex system relationships. Let students know that they will be exploring cause-effect and system feedback relationships between carbon dioxide and water vapor in this activity. Ask students to think about how each piece of the system affects other pieces of the system.
4. Introduce and discuss the use of computational models.
Introduce the concept of computational models, and give students an example of a computational model that they may have seen, such as forecasting the weather. Project the NOAA Weather Forecast Model, which provides a good example of a computational model. Tell students that:
- scientists use information about the past to build their climate models.
- scientists test their climate models by using them to forecast past climates.
- when scientists can accurately forecast past climates, they can be more confident about using their models to predict future climates.
5. Have students launch the Interactions Within the Atmosphere interactive.
Provide students with the link to the Interactions Within the Atmosphere interactive. Divide students into groups of two or three, with two being the ideal grouping to allow groups to share a computer workstation. Tell students they will be working through a series of pages of models with questions related to the models. Ask students to work through the activity in their groups, discussing and responding to questions as they go.
NOTE: You can access the Answer Key for students' questions—and save students' data for online grading—through a free registration on the High-Adventure Science portal page.
Let students know that this is Activity 3 of the What Is the Future of Earth's Climate? lesson.
6. Have students discuss what they learned in the activity.
After students have completed the activity, bring the groups back together and lead a discussion focusing on these questions:
- What do models help you visualize? (Models are used to show systems that are too small to see or too big to see. They can also show events that happen really fast or really slow, allowing you to see what's happening.)
- What are the similarities and differences between the Earth System Model (Model 1) and the Molecular Model (Model 2)? (Both models show the interactions of radiation [solar and infrared] with particles on Earth. The molecular model shows how the greenhouse gases absorb and reflect only the infrared radiation in a way that is more difficult to see in the larger-scale model [Earth system model]. The larger-scale model shows how the temperature changes as a result of the greenhouse gases.)
- What are the limitations of the models in this activity? (The models don't show all of the types of radiation emitted by the sun. They also don't show all of the interactions that happen in Earth's climate system.)
- Based on these models, what is the relationship between atmospheric carbon dioxide and temperature? (When there is more carbon dioxide, there is a higher temperature. This is because carbon dioxide is a greenhouse gas.)
- Show the Keeling curve. Why do you think the carbon dioxide level fluctuates so regularly? (The carbon dioxide level fluctuates because of the seasons. In the spring and summer, plants are actively growing and taking up carbon dioxide. In the winter, plants are not growing, and as organisms decay, carbon dioxide is released into the atmosphere.)
- Based on the Keeling curve, what do you expect the temperature of Earth to do? (Based on the Keeling curve, the temperature should increase. This is because carbon dioxide is a greenhouse gas, which absorbs and re-emits infrared radiation in the atmosphere, keeping heat energy in the atmosphere for longer than would happen without greenhouse gases.)
Informal Assessment
1. Check students' comprehension by asking them the following questions:
- What two things can happen to solar radiation as it enters Earth's atmosphere?
- Which type of solar radiation is absorbed by greenhouse gases?
- What is the long-term trend of carbon dioxide concentration in the atmosphere and global temperature?
2. Use the answer key to check students' answers on embedded assessments.
Tips & Modifications
Teacher Tip
This activity is part of a sequence of activities in the What Is the Future of Earth's Climate? lesson. The activities work best if used in sequence.
To save your students' data for grading online, register your class for free at the High-Adventure Science portal page.
Modification
This activity may be used individually or in groups of two or three students. It may also be modified for a whole-class format. If using as a whole-class activity, use an LCD projector or interactive whiteboard to project the activity. Turn embedded questions into class discussions. Uncertainty items allow for classroom debates over the evidence.
Connections to National Standards, Principles, and Practices
National Science Education Standards
- (5-8) Standard A-1: Abilities necessary to do scientific inquiry
- (5-8) Standard A-2: Understandings about scientific inquiry
- (9-12) Standard A-1: Abilities necessary to do scientific inquiry
- (9-12) Standard A-2: Understandings about scientific inquiry
- (9-12) Standard D-1: Energy in the earth system
Common Core State Standards for English Language Arts & Literacy
- Reading Standards for Literacy in Science and Technical Subjects 6-12: Craft and Structure, RST.11-12.4
- Reading Standards for Literacy in Science and Technical Subjects 6-12: Key Ideas and Details, RST.9-10.1
- Reading Standards for Literacy in Science and Technical Subjects 6-12: Craft and Structure, RST.9-10.4
- Reading Standards for Literacy in Science and Technical Subjects 6-12: Key Ideas and Details, RST.6-8.1
- Reading Standards for Literacy in Science and Technical Subjects 6-12: Key Ideas and Details, RST.11-12.1
- Reading Standards for Literacy in Science and Technical Subjects 6-12: Key Ideas and Details, RST.11-12.3
- Reading Standards for Literacy in Science and Technical Subjects 6-12: Craft and Structure, RST.6-8.4
- Reading Standards for Literacy in Science and Technical Subjects 6-12: Key Ideas and Details, RST.9-10.3
- Reading Standards for Literacy in Science and Technical Subjects 6-12: Key Ideas and Details, RST.6-8.3
ISTE Standards for Students (ISTE Standards*S)
- Standard 3: Research and Information Fluency
- Standard 4: Critical Thinking, Problem Solving, and Decision Making
Next Generation Science Standards
- Crosscutting Concept 2: Cause and effect: Mechanism and prediction
- Crosscutting Concept 3: Scale, proportion, and quantity
- Crosscutting Concept 4: Systems and system models
- Crosscutting Concept 5: Energy and matter: Flows, cycles, and conservation
- Crosscutting Concept 7: Stability and change
- HS. Earth and Human Activity: HS-ESS3-5. Analyze geoscience data and the results from global climate models to make an evidence-based forecast of the current rate of global or regional climate change and associated future impacts to Earth systems.
- HS. Earth and Human Activity: HS-ESS3-6. Use a computational representation to illustrate the relationships among Earth systems and how those relationships are being modified due to human activity.
- HS. Earth's Systems: HS-ESS2-6. Develop a quantitative model to describe the cycling of carbon among the hydrosphere, atmosphere, geosphere, and biosphere.
- HS. Earth's Systems: HS-ESS2-4. Use a model to describe how variations in the flow of energy into and out of Earth's systems result in changes in climate.
- HS. Earth's Systems: HS-ESS2-2. Analyze geoscience data to make the claim that one change to Earth's surface can create feedbacks that cause changes to other Earth systems.
- MS. Earth and Human Activity: MS-ESS3-5. Ask questions to clarify evidence of the factors that have caused the rise in global temperatures over the past century.
- Science and Engineering Practice 1: Asking questions and defining problems
- Science and Engineering Practice 2: Developing and using models
- Science and Engineering Practice 4: Analyzing and interpreting data
- Science and Engineering Practice 6: Constructing explanations and designing solutions
- Science and Engineering Practice 7: Engaging in argument from evidence
- Science and Engineering Practice 8: Obtaining, evaluating, and communicating information.
Credits
Media Credits
The audio, illustrations, photos, and videos are credited beneath the media asset, except for promotional images, which generally link to another page that contains the media credit. The Rights Holder for media is the person or group credited.
Researchers
Writers
Editor
Copyeditor
Expert Reviewer
other
Last Updated
July 23, 2026
User Permissions
For information on user permissions, please read our Terms of Service. If you have questions about how to cite anything on our website in your project or classroom presentation, please contact your teacher. They will best know the preferred format. When you reach out to them, you will need the page title, URL, and the date you accessed the resource.
Media
If a media asset is downloadable, a download button appears in the corner of the media viewer. If no button appears, you cannot download or save the media.
Text
Text on this page is printable and can be used according to our Terms of Service.
Interactives
Any interactives on this page can only be played while you are visiting our website. You cannot download interactives.