Scale, a fundamental concept of geography, has many different types each of which tells an aspect of the story about how Earth's systems work.
Grades
7 - 12+
Subjects
Geography, Geographic Information Systems (GIS), Human Geography, Physical Geography
Image
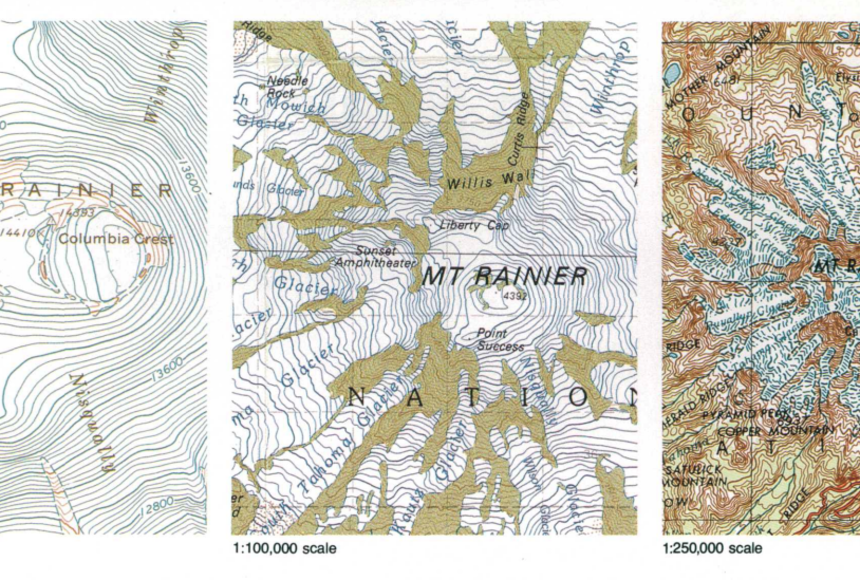
Three Different Scales
Moving from left to right, three examples of scale from a large scale map to a smaller scale map.
Maps by the USGS
Share on Twitter
Share on Facebook
Share on Pinterest
Share on Google Classroom
Share on MS Teams
Share via email
Print
is a of and is as for understanding and its as it is for . Its definition is often debated by , in part, because various subfields of geography use scale in different ways. Generally, scale is a form of size.
or Carto
Map or cartographic scale is the of a distance on Earth compared to the same distance on a map. There are three types of scales commonly used on maps: written or , a graphic scale, or a fractional scale. A written or verbal scale uses words to describe the relationship between the map and the it depicts such as one inch represents one mile. A map reader would use a ruler to measure the distances between places. A graphic scale is a bar marked off like a ruler with labels outlining the distances the segments represent. Just as you would with a written or verbal scale to measure distance with this type of scale you would use a ruler. Finally, a fractional scale, typically represented as a ratio (1/50,000 or 1:50,000), indicates that one unit (inch, centimeter, football field or pitch, etc.) on the map represents the second number of that same unit on Earth. So if the ratio was 1:50,000 one centimeter on the map would represent 50,000 centimeters (500 meters) in real life. The whole map, at this ratio, would a typical in the United .
Somewhat we describe detailed maps of smaller areas as large scale maps and maps as small scale. This is best illustrated with the fractional scale system. A large-scale map has a smaller ratio (1:10,000 or 1:25,000) and would have more details such as streets and building footprints. Whereas a small-scale map has a larger ratio (1:500,000 or 1:1,000,000) and illustrates an entire state, , or with just the larger cities or and major . Maps are not complete without a scale. It is key to making an accurate and understandable map.
Spatial Scale
There are three more general ways to describe scale as well: , regional, and global. Local-scale is a specific place with such as , , and .
Regions, however, vary considerably in size. They are generally larger than one place, such as a town or , and may include several towns or multiple states or provinces. There are three types of regions: formal, functional, and vernacular. The easiest to identify is a as it has recognized boundaries or and often . An example would be the German state of Bavaria or the . A functional, or nodal, region is characterized by a common point or and is frequently used to describe areas such as the around Washington, D.C. in the United States. Finally, a vernacular or is one that has characteristics that are perceived to be different from that of the surrounding areas. An example would be the in the United States. Certain economic activities and are attributed to an area that encompasses nine U.S. states that the covers.
Global-scale, of course, covers all of Earth. Studying at this scale is critical due to . As the world becomes more information, goods, and ideas are traded at faster and faster rates changing the way we communicate and live. While most feel globalization has not destroyed the uniqueness of specific places, forces promoting globalization often come into conflict with those focused on preserving local . Additionally, in some cases, globalization has increased the gap between wealthy and poorer .
Examining patterns in different scales is critical to understanding the problem and its effects, which often vary by location. In the study of , choices made at the local level, such as burning for power, can have larger impacts at the regional level (e.g., ) or the global level where we see the increase in atmospheric leading to rising temperatures. The results of the rising levels of carbon dioxide have different impacts on different localities. regions battle rising and the ground is shifting below communities as the melts. In order to appropriately understand and address complex issues like climate change, we need to examine it and devise solutions at multiple scales.
Credits
Media Credits
The audio, illustrations, photos, and videos are credited beneath the media asset, except for promotional images, which generally link to another page that contains the media credit. The Rights Holder for media is the person or group credited.
Writer
Sarah Appleton, National Geographic Society, National Geographic Society
other
Last Updated
October 19, 2023
User Permissions
For information on user permissions, please read our Terms of Service. If you have questions about how to cite anything on our website in your project or classroom presentation, please contact your teacher. They will best know the preferred format. When you reach out to them, you will need the page title, URL, and the date you accessed the resource.
Media
If a media asset is downloadable, a download button appears in the corner of the media viewer. If no button appears, you cannot download or save the media.
Text
Text on this page is printable and can be used according to our Terms of Service.
Interactives
Any interactives on this page can only be played while you are visiting our website. You cannot download interactives.