ARTICLE
ARTICLE
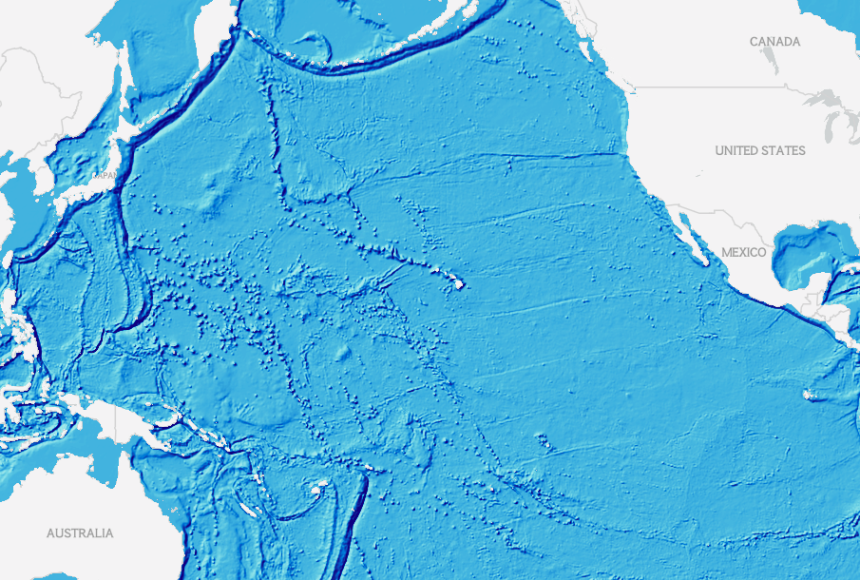
MapMaker: Seafloor Bathymetry
MapMaker: Seafloor Bathymetry
It is important to map the seafloor so we can regulate extraction operations (mining, drilling for oil), keep ships and shipping routes safe, lay new underwater pipes and cables, and protect marine species and habitats. Explore the bathymetry of the ocean floor with this map layer.
Grades
5 - 12+
Subjects
Geography, Human Geography, Physical Geography, Geographic Information Systems (GIS), Earth Science, Geology, Oceanography, Conservation, Biology
Image
Map by National Geographic
Media Credits
The audio, illustrations, photos, and videos are credited beneath the media asset, except for promotional images, which generally link to another page that contains the media credit. The Rights Holder for media is the person or group credited.
GIS Specialist
Writer
Last Updated
October 19, 2023
For information on user permissions, please read our Terms of Service. If you have questions about how to cite anything on our website in your project or classroom presentation, please contact your teacher. They will best know the preferred format. When you reach out to them, you will need the page title, URL, and the date you accessed the resource.
Media
If a media asset is downloadable, a download button appears in the corner of the media viewer. If no button appears, you cannot download or save the media.
Text
Text on this page is printable and can be used according to our Terms of Service.
Interactives
Any interactives on this page can only be played while you are visiting our website. You cannot download interactives.