ENCYCLOPEDIC ENTRY

ENCYCLOPEDIC ENTRY

Population Pyramid

Population Pyramid

Population pyramids are important graphs for visualizing how populations are composed when looking a groups divided by age and sex. There are three trends in population pyramids: expansive, constrictive, and stationary.

Grades

5 - 8

Subjects

Geography, Human Geography, Social Studies

Image

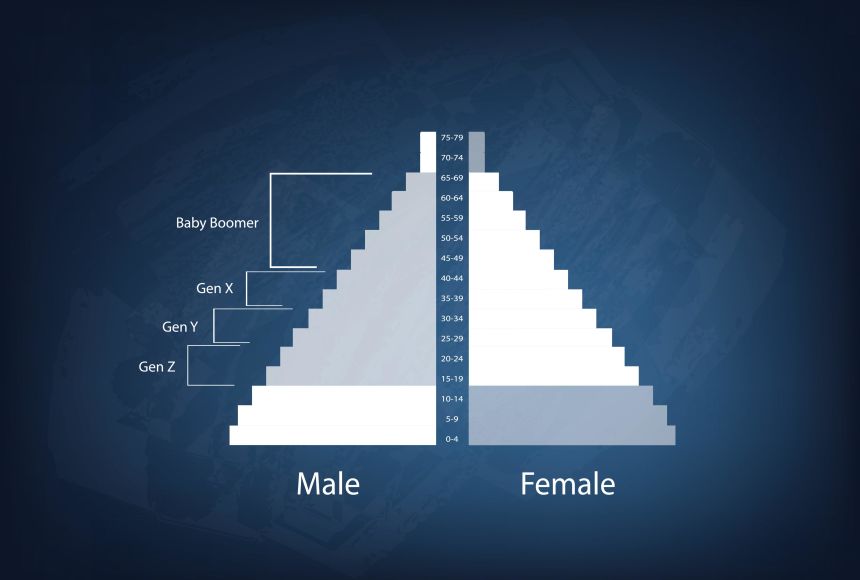
Generic Population Pyramid

Population pyramids help show how populations are composed and how they are changing. Here is a generic population pyramid showing various age groups: baby boomers, Generation X, Generation Y, and Generation Z.

Graphic by suwannee suwanchwee / Alamy Stock Vector
Population pyramids help show how populations are composed and how they are changing. Here is a generic population pyramid showing various age groups: baby boomers, Generation X, Generation Y, and Generation Z.

A population pyramid is a way to visualize two variables: age and sex. They are used by demographers, who study populations. A population pyramid is a graph that shows the distribution of ages across a population divided down the center between male and female members of the population. The graphic starts from youngest at the bottom to oldest at the top. It is called a population pyramid because when a population is growing (there are more babies being born than there are people dying), the graphic forms the shape of a triangle. A population pyramid can be used to compare differences between male and female populations of an area. They also show the number of dependents (children and, sometimes, elderly people) and general structure of the population at any given moment.

There are three main trends in populations that affect the shape of a population pyramid. The first is when there are both high fertility and high mortality rates among younger members. This type of population, known as “expansive,” creates a sharp triangle shape in the graph. Expansive pyramids mean that the population does not increase much in total number and has many young people. The second trend, known as “constrictive,” is when there is a lower mortality rate with the fertility rate remaining constant. These population pyramids are wider in the middle of the graph as the population has high numbers of middle aged and elderly people, but fewer young people. The third trend is “stationary” which is a population with low mortality and low fertility rates. These graphs have a square or “pillar” shape rather than a pyramid one. These population pyramids represent a stable population that will not change significantly barring any sudden changes to fertility or mortality rates.

Population pyramids are useful for studying the future of a region as well as examining historical and current population trends. If part of the population has been affected by sudden changes, such as casualties from armed conflict, high female mortality in childbirth, or the migration of young workers out of poorer regions, the graph will offer a way to visualize how the future population will be affected. They can also help direct government and private industry distribution of services for regions based on population needs.

Media Credits

The audio, illustrations, photos, and videos are credited beneath the media asset, except for promotional images, which generally link to another page that contains the media credit. The Rights Holder for media is the person or group credited.

Director
Tyson Brown, National Geographic Society
Author
National Geographic Society
Production Managers
Gina Borgia, National Geographic Society
Jeanna Sullivan, National Geographic Society
Program Specialists
Sarah Appleton, National Geographic Society, National Geographic Society
Margot Willis, National Geographic Society
Producer
Clint Parks
Intern
Roza Kavak
other
Last Updated

October 19, 2023

For information on user permissions, please read our Terms of Service. If you have questions about how to cite anything on our website in your project or classroom presentation, please contact your teacher. They will best know the preferred format. When you reach out to them, you will need the page title, URL, and the date you accessed the resource.

Media

If a media asset is downloadable, a download button appears in the corner of the media viewer. If no button appears, you cannot download or save the media.

Text

Text on this page is printable and can be used according to our Terms of Service.

Interactives

Any interactives on this page can only be played while you are visiting our website. You cannot download interactives.

Related Resources