Use this map layer to investigate which urban areas are hotter than the average temperature of the city. See where urban heat islands are most severe in the United States, and explore the impacts and solutions to reduce urban heat islands.
Grades
5 - 12+
Subjects
Biology, Ecology, Health, Conservation, Earth Science, Climatology, Geography, Geographic Information Systems (GIS), Human Geography, Physical Geography
(UHIs) occur when parts of a with highly concentrated and little contain pockets or islands with hotter than surrounding or areas. Concrete can experience average temperatures that are 2.8-3.9°C (5-7°F) hotter during the day and 1.1-2.8°C (2-5°F) warmer at night than nearby, rural . Though the ’s heat and light reach urban, suburban, and rural areas in similar ways, temperatures depend on how well each holds heat.
Heat islands commonly form in areas with highly concentrated infrastructure, , and vegetation—all characteristics of urban regions.
Infrastructure: Dark-colored structures like buildings and absorb and re-emit the sun’s heat. This causes heat islands to become pronounced even during cooler nighttime temperatures, as these structures slowly release the heat they absorbed during the day. Tall buildings and tight streets within a city can trap hot air and reduce airflow in a way that contributes to a structure’s ability to release heat.
Human Activity: Air-conditioning units, , industrial facilities, and condensed areas with a lot of people all generate waste heat that can inflate the temperature difference between urban and outlying areas. Heat islands promote increased use of air conditioning, which can amplify energy use and produce more heat.
Vegetation: The amount of vegetation affects the temperature of an area through a process called evapotranspiration. In this process, plants absorb water from the ground that is then converted into and released into the air. This acts as a natural air conditioner, as water vapor lowers surface and air temperatures. Vegetation can also help lower high temperatures by providing shade.
Urban heat islands impact the environment through . Urban heat islands experience reduced water quality from flowing over hot, surfaces like rooftops and paved roads. This heated water carries heavy metals, , , and other , to drain through and into natural bodies of water to cause minor temperature changes. These changes can cause accelerated bacteria and growth, which can upset an and further local water quality.
Urban heat islands can also have negative effects for many populations including older adults, young children, populations, people who work outdoors, and people with pre-existing health conditions. All of these populations are to heat and can cause a variety of health issues if not paid attention to. For example, young children are susceptible to extreme heat due to their breathing rates relative to their small body size. This increases the chance for their to become aggravated and develop . Low-income populations are also at a greater risk of heat-related illnesses due to poor housing conditions and inadequate resources to stay cool and hydrated.
How can we reduce urban heat islands?
Planting trees around the city and along paved streets lowers surface and air temperatures by providing shade and cooling through evapotranspiration.
Reduce by performing and staying aware of your air-conditioning unit. Replacing disposable air filters, turning your air-conditioning fan to auto, and cleaning debris around your air conditioning unit are some easy ways to keep energy usage low. Preventing indoor heat gain also reduces energy consumption because your air-conditioning won’t need to work as hard to regulate a set indoor temperature. A few ways you can prevent indoor heat gain are to shade windows that receive a lot of sunlight, paint your walls a lighter color, and keep all windows and doors tightly shut.
Reduce energy consumption by turning off your air-conditioning, lights, and ceiling fans when it is safe to do so. This will reduce energy consumption that would otherwise be used to power these appliances for no reason.
are plants, shrubs, grasses, or trees grown on a rooftop. Doing this helps reduce the temperatures of roof surfaces and the surrounding air. Green roofs can also reduce water and thus improve water quality by filtering and absorbing rainwater as it falls.
Cool roofs are made of coatings or materials that reflect heat and sunlight away from a building. Installing one could lower energy costs and cool the building, making it more comfortable for its occupants.
Cool pavements are composed of newer paving materials that reflect more , increase the rate of water , and allow newer sidewalks and streets to remain cooler than traditional pavements. Working to replace conventional pavements with cool pavements could dramatically reduce the temperature in more urban heat islands.
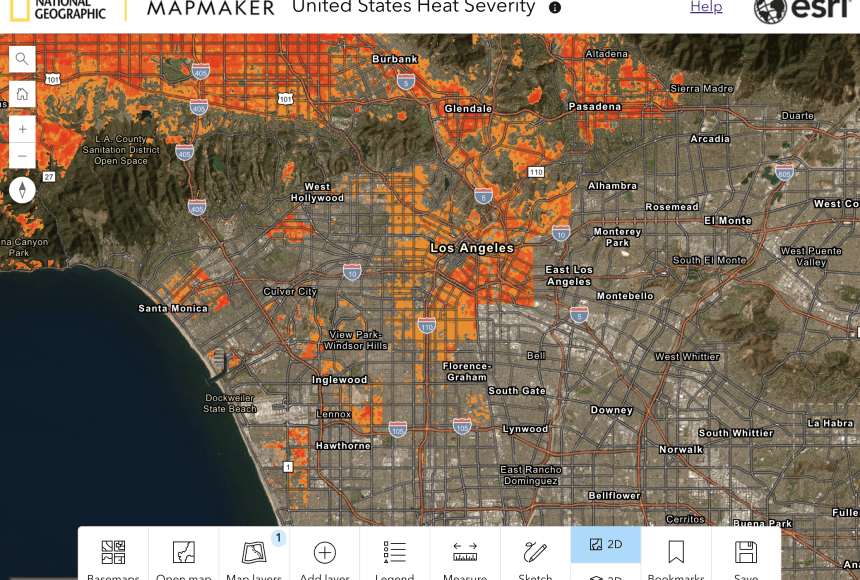
This map layer demonstrates the distribution of urban heat islands by severity on a scale of one to five, where one represents a relatively mild heat area (slightly above the city’s average temperature) and five marks a severe heat area (dramatically above the city’s average temperature). This map layer was produced by Descartes Labs. During the summer of 2021, a satellite with a thermal sensor measured the temperature of the surface of Earth in 30-meter by 30-meter boxes, called cells or pixels. When temperatures from 2021 weren’t available, the data was patched with measurements from the previous summer. Experts then used computers to calculate the average temperature for each cell over the United States. For the cells over urban areas, they compared the average temperature to those over suburban and rural areas nearby then assigned the appropriate value (1-5) on the urban heat severity scale. This type of data set, where a matrix of cells or pixels is organized into rows or columns, is called a raster.
Credits
Media Credits
The audio, illustrations, photos, and videos are credited beneath the media asset, except for promotional images, which generally link to another page that contains the media credit. The Rights Holder for media is the person or group credited.
Writer
McClain Martensen
GIS Specialist
Anita Palmer
Eleanor Horvath, National Geographic Society
Jasmin López Gómez, National Geographic Society
Manager
Sarah Appleton, National Geographic Society, National Geographic Society
other
Last Updated
September 5, 2024
User Permissions
For information on user permissions, please read our Terms of Service. If you have questions about how to cite anything on our website in your project or classroom presentation, please contact your teacher. They will best know the preferred format. When you reach out to them, you will need the page title, URL, and the date you accessed the resource.
Media
If a media asset is downloadable, a download button appears in the corner of the media viewer. If no button appears, you cannot download or save the media.
Text
Text on this page is printable and can be used according to our Terms of Service.
Interactives
Any interactives on this page can only be played while you are visiting our website. You cannot download interactives.